
By: Jeremy Mayer Oct 29/2025
Digital marketing is all about data. It is one of the biggest differentiators compared to traditional media. It has become so important in the competitive digital landscape that it has resulted in scandals such as Facebook’s Cambridge Analytica Scandal (2018), where data from Facebook user profiles was used to create complex psychological profiles for political ad targeting. This race for user data and the various scandals that have ensued have also led to governments and the European Union implementing legislation, such as GDPR, and companies like Apple introducing features like the ability to block apps from collecting your data. All this to say, there are huge amounts of data available for digital marketing in the marketing platforms.
Platforms like Facebook and Instagram, under the Meta umbrella, have detailed targeting options for ad targeting based on user interest and activity profiles, as we provide them with so much information about our interests through the pages, profiles, and posts we interact with. Google uses our search activity to understand how we search and what types of products and services we’re actively searching for. LinkedIn contains a wealth of information about job titles, the company we work for, and our role responsibilities, all from the information we provide in our profiles. All this data can be used by a savvy digital marketer to target campaigns in an attempt to reach the right kinds of users who will turn into customers for the business running ads.

Once these ads are running, there is a huge amount of performance data in platforms like Google Ads, Meta Ads, LinkedIn Ads, as well as analytical tools like Google Analytics 4 (which tracks user activity on the website). A fundamental role of a digital marketing professional is to turn this data into actionables that improve campaign performance and to use it to report to stakeholders on the performance of the ads. For industries like e-commerce, the data available can demonstrate the entire path of a user to the point of revenue generation on the website. For service-based businesses, this is a little harder, since the last digital conversion point tracked by many small businesses is the call or form submission, where the user was looking for information. After that, it requires a more structured setup to determine what revenue value those users generated and what marketing channels brought them there in the first place.
In many cases, campaigns optimized using this information alone generate strong results. However, for those interested in taking campaign optimization a step further, there are many areas of your business and public websites that contain powerful data that we may not think to use for planning and optimizing marketing campaigns. In this article, I’m going to go over some examples that I’ve used in the past with the goal of inspiring you to think about the data you may have that you can leverage for your marketing. At Snaptech, we work with a lot of small businesses, so rather than taking you on a journey into how you can leverage this from a more complex data science perspective, I’ll focus on free ways that this data can be leveraged and merged to generate useful insights.
Attributing form submissions to the marketing channels that generated them is one area where many businesses miss out. CRM tools like Hubspot have native integration and tracking, but come at a high cost. There are integrations for forms like Gravity Forms and other WordPress forms that will track the source of the form if it contains a GCLID or UTM (ways to track marketing sources), but require technical setup. However, nearly every form system will capture the day and time of the form submission. We can use this data, and data from a properly set up Google Analytics 4 property, to attribute most form submissions to the respective channels the user visited the site through to convert.
My tool of choice for this is Google Looker Studio and Google Sheets. Since they are Google products, they integrate well. Google Analytics 4 data can be imported easily through the native connection. The way I go about merging this data is by generating a spreadsheet of the contact form information with the date and hour of submission formatted in the format YYYYMMDDHH, so a form submission on August 28 2025, at 10:30 am would look like 2025082810 in the respective cell in the spreadsheet. The next step is to find the data in Google Analytics 4. For this, creating an exploration report with the date + hour dimension and the events for form submissions will get you the data you need.

Download this data and make sure the date and hour data have the same formatting as the other spreadsheet (sometimes you have to reformat it because it’s downloaded with American date formatting YYYYDDMM).
Next, go to Google Looker Studio and import both spreadsheets. Use the option to blend data and use the date and hour columns as the “join key”. This can then be turned into a chart in Looker Studio that now shows most form submission source and medium (data from GA4) attribution.

In the example screenshot, the client added a column where they qualified the lead quality in the spreadsheet. Using this data and the internal knowledge of whether leads turned into business, decisions can be made on the effectiveness of different marketing channels. This specific client has used a variety of channels, from the traditional digital platforms to listing sites like Clutch.co. Using this data, we have refined where they spend their marketing dollars to maximize the return on their investment. This whole process only takes a few hours to set up, but it provides significant value to the marketing efforts and uses readily available data.
Nonprofits and government institutions provide a wealth of data to the public. One common way that we’ve used this data in setting our targeting for ad campaigns is with census data on the more affluent neighbourhoods for clients whose products come at a higher price point. This is fairly simple to research and input into the location targeting in the platforms.
One area where we’ve taken this a step further is for a company in the HVAC sector. We needed to find out what the optimal time of year was to turn on our campaigns for heating repairs and installation to avoid wasted spend during the months coming up to the cooler seasons, where there may be clicks but a lack of intent to convert.
For this, we used readily available temperature and precipitation data from the Government of Canada website. We created a spreadsheet mapping the temperature and precipitation over time and turned this into a graph in Looker Studio.

In a second line graph on the same page in Looker Studio, we mapped the contact form submissions and calls over time. Comparing the two graphs, it was clear that at 15 degrees Celsius as an average temperature, the number of users contacting the business rose.
Using this data, we were able to get ahead of demand by launching digital campaigns a week to two weeks in advance of this average temperature occurring, which in the Lower Mainland can be anywhere from mid-September to mid-October.
This is a very specific example since it is clear without the data that demand for heating services would increase with a decrease in temperatures in the fall and winter months. However, being able to predict more clearly what that exact threshold is provides lots of opportunity to get the brand awareness going ahead of that drop in temperature.
Spending time thinking about what factors may impact your business is a great starting point to then figure out what public data you could use to predict when to increase or decrease advertising spend or when to launch specific campaigns. Another example I have heard of in the past is pharmaceutical companies using data on when there are spikes in flu prevalence to launch their ad campaigns for flu medicine. Temperature and seasons have a big impact on what we do, so they are usually a great starting point.
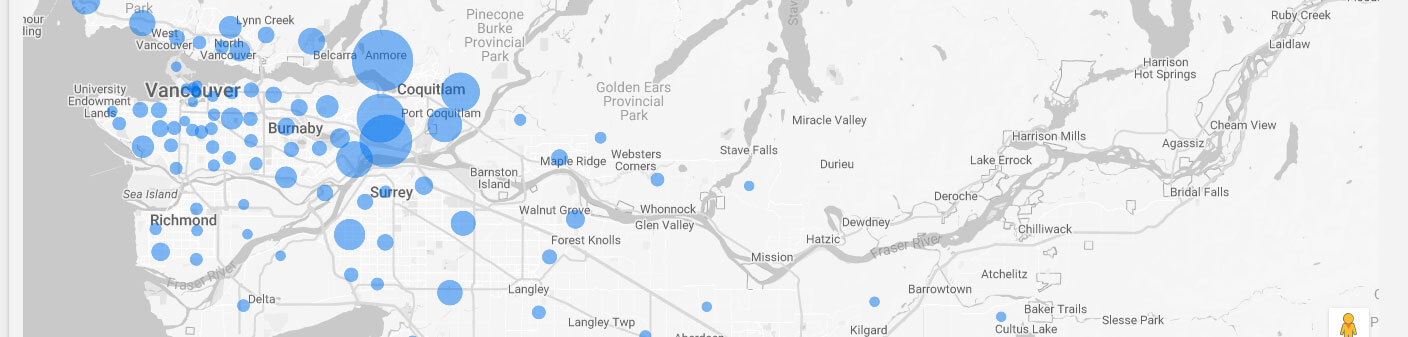
We’ve already talked about using form submission data as internal data to try to understand where leads come from. One other use of internal data is through mapping. Most companies will collect some form of address when they either collect payment or offer services or delivery of products. With even a very basic CRM system, this data will include the type of service and revenue generated. Looker Studio offers quite a few different mapping graphs to maximize the use of this data. The first step is always to get it in a spreadsheet format (Google Sheets works best), then upload that data as a data source into Looker Studio. Use a Google Maps type of chart. Sometimes the formatting of data needs to be modified to work effectively but in the end you should get something that looks like this:

This is a great visual representation of the areas that generate the most revenue for the company. Unsurprisingly, the areas nearest the office generate the most revenue. However, there are other interesting insights, like the North Vancouver area and the pockets in the west of Surrey. These insights help better inform where to target the advertising budget to maximize return-on-investment. By using the filter options in Looker Studio, we can also filter by service type to see the difference in revenue distribution across the various services offered and use that data to split campaigns into those targeting the top revenue-generating regions for each service type.
This type of mapping can be used in any instance where data is associated with an address or postal/zip code.
All of these examples use free tools, internal or public data, and a few hours to make sure they are all working, but provide significant data for planning and optimizing campaigns beyond what the platform offers. One of the more powerful tools in creating all of these is the Merge Data option in Looker Studio. Having an understanding of how this works can take your analysis to the next level and help you look at where you might be able to find this data to help strategize and inform your advertising.
This is just one part of the services we offer to our clients. If you aren’t sure where to get started or would like more information on our services and data reporting. Contact us today!